Find Current Sheets in 1000 Cube Simulation
1. Introduction
Definition:
Current sheets are geometrically connected structures (usually thin) within which an electric current is confined. Examples of current sheets can be found in the solar heliosphere, solar flares, and other high energy astrophysical systems such as accretion disks.
Motivation:
Current sheets are not only places where magnetic energy dissipated, but also closely related to magnetic reconnection and MHD turbulence which have been recognized as critical to understanding many physical phenomena both on Earth and in space. It is therefore very important to study the properties of current sheets.
Method:
We ran large scale MHD simulations in $1000^3$ cube (resolution) to study the turbulent flow and field. Each snapshot of the 3D cube would be about $\sim 10$ Gbytes which forms the data we are trying to explore. We will apply our feature finding algorithms to identify all the current sheets in the cube.
Goal:
the goal is to identify all the sheets, characterize their sizes, and study their properties statistically.
A complete notebook can be found here
2. Data Preparing: construct the current data
2.1 load 3d data
The data file is in HDF5 format, and each component of magnetic field has $1000^3$ data points which corresponds to $8$ Gb and takes $50$ seconds to load on a single computer with 512G of RAM and 20 processors called Tigressdata at Princeton.
2.2 construct current density $\mathbf{j} = \nabla \times \mathbf{B}$
- use cell-centered B with second order accurate central differences gradient to calculate the current density; so the derived j is also on cell center.
- Show a small section of a slice of the data cube: From left to right, azimuthal field $B_y$, radial component of the current density $j_x$ ($j_x = -\partial_z B_y + …$), and the magnitude of current density $j$

3. search for the current sheet based on $j^2$
3.1. find the threshold of $j^2$ above which we define a current sheet
We define the threshold $j_{th}$ by asking $25\%$ of the total dissipation poccesses a current density $j > j_{th}$. We use binary search to find the threshold.
3.2. extract locations of individual current sheets with feature finding algorithm
- based on connected-component labeling algorithm from sk-learn.
- assuming 1-connectivity (6 cells in 3d), i.e. only the surface-attached cells are counted, no diagonal/corner cells
- j above the threshold is included
- time cost for identifying 230914 features: 14.697491169 seconds
- sort and store each current sheet a dictionary which consists cell location in the cube and current density magnitude as key and value. The whole set of current sheets form a list.
- time cost for populating =: 14.4376769066 seconds
- time cost for sorting = 0.136938095093 seconds
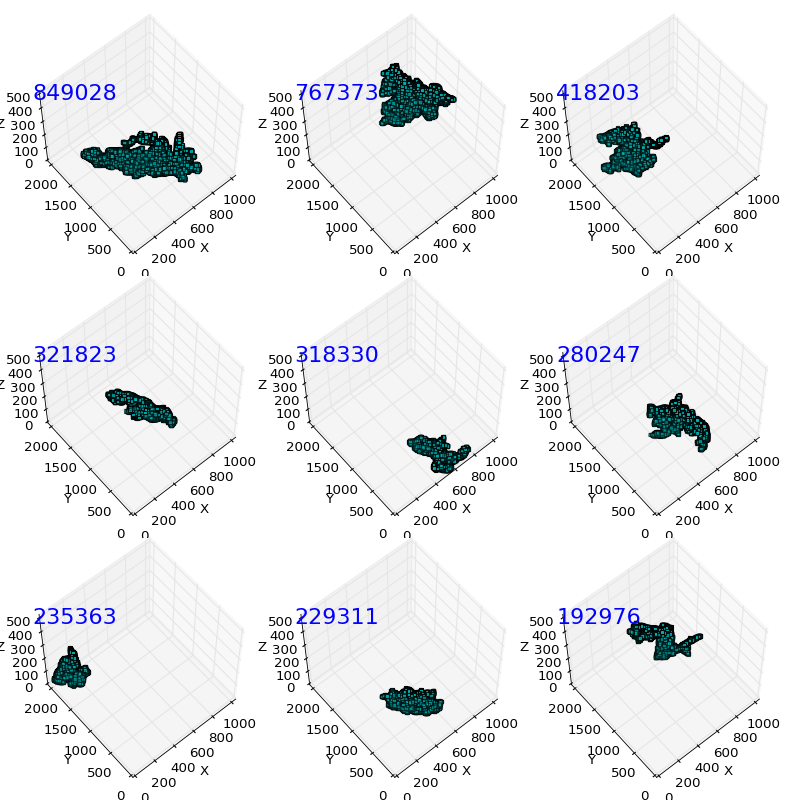
- first top 5 largest sheets size in cells: [849028, 767373, 418203, 321823, 318330]
4. Visualization of current sheets
4.1. the top 9 sheets (interactive scattering plots)
Here we use the scattering plots to show the general structures of a few largest sheets identified in our data. THe numbers listed on top left are total grid points (cells) in given current sheet.
4.2 Visualize a single sheet with details
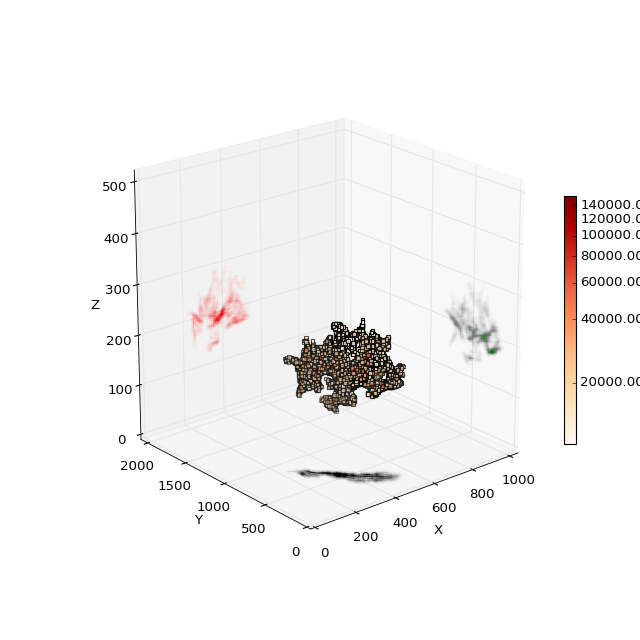
Take the eighth largest sheet for example, we draw the sheet itself with color coded current density, we also draw the projections of the sheet onto the cube surfaces as shown in color.
5. Dimensions of current sheets
5.1. dimensions of single current sheet ($\lambda,\xi,l$)
- Apply the Principle Component Analysis (PCA) on one single sheet, determine first three componet vectors which are orthogonal to each other. Again we take the eighth largest sheet as an example.
- The vector we found is [[-0.01432627 -0.91528103 0.40256104] [-0.8827452 -0.17751756 -0.43502694] [ 0.46963356 -0.36159114 -0.80541677]
-
With pca.components $\mathbf I_i$, calculate the geometrical size ($\lambda,\xi,l$) as follows:(1) define the projected distance of a grid point $\mathbf{x_j}$ onto $\mathbf{I_i}$ as $d_{ij} = \mathbf{x_j}\cdot \mathbf{I_i}\, /\, ||\mathbf{I_i}||$ (2) define the length $\lambda$, width $\xi$, height $l$ as the difference between the largest and the smallest $d_{ij}$ for the 1st, 2nd and 3rd components
- We found for this given sheet, the length, width, and thickness are about 1.5, 0.7, and 0.25 respectively, which indicates a prolate shape.
5.2 $(\lambda,\xi,l)$ for all current sheets
We include the calculation of the dissipation as well.
- we ask our current sheets to have at least 30 gird points in order to perform a sensible PCA. Essentially, we could do stability test for the small size sheets to tell if a viable PCA is achieved.
- To expedite the PCA for all sheets, we make use of multiprocessing to spawn parallel jobs.
- time spent for 18298 sheets with 8 processors = 30.2479219437 seconds
6. Some statisitics about current sheets
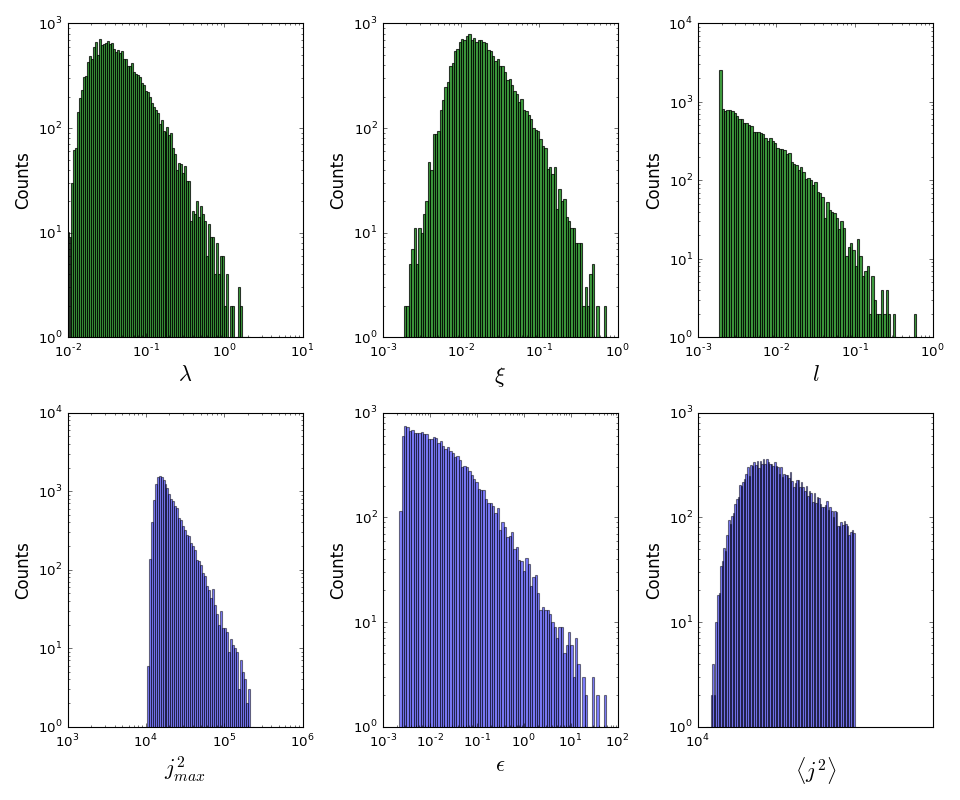
6.1 histogram of $j_{max}$, $\epsilon$, and sizes for all sheets
- From the distribution, we find that most of the sheets have length $\sim 0.3H$ and width about $\sim 0.1 H$, and thickness of about 2 grid cells, indeed very thin.
- The distribution of maximum current density scales as $j_{max}^{-4}$ steeply indicating a $j_{max}$ cutoff exists
- The distribution of dissipated energy within given sheet drops almost linearly with increasing $\epsilon$.
- The distribution of sheet averaged current density is narrowly distributed above the threshold value.
6.2 Correlation analysis
In the plot below, we explore the correlation among current sheet aspect ratio $\lambda/\xi$ (length/width), maximum current density $j_{max}$, volume averaged dissipation rate $\langle\epsilon\rangle$, and number of cells $N$ (volume) for all sheets. We plot the correlation between $j_{max}$ (in x-axis) and $\langle\epsilon\rangle$ (in y-axis), the color shows the aspect ratio while the size of the bubble shows the $N^{1/2}$.
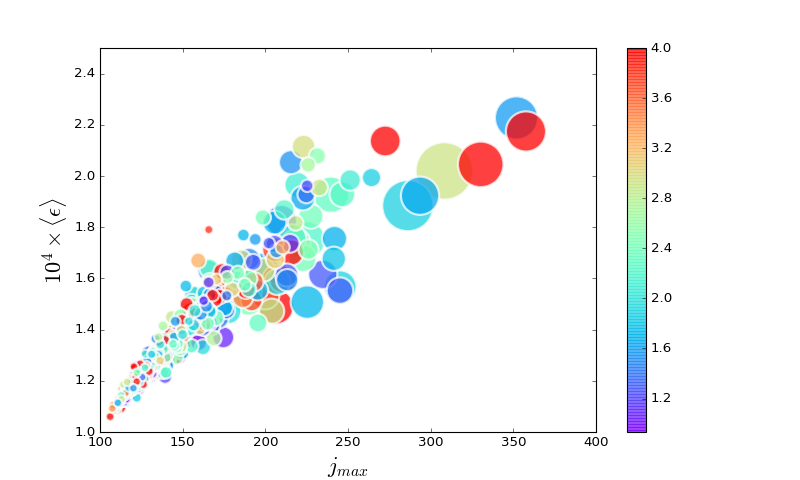
The bubble chart above shows us: * There is a strong positive correlation between $j_{max}$ and $\langle\epsilon\rangle$, current sheet that holds greater peak values of current density in general also has stronger volume averaged dissipation. * current sheet that holds greater peak current density values also tend to be bigger in size, but not correlated with the extreme elongated shapes. * bigger current sheets therefore tend to have higher peak current density values and greater dissipation rate. Energetically speaking, they tend to dominate those smaller ones.
6.3 3d correlation of the sheet dimensions
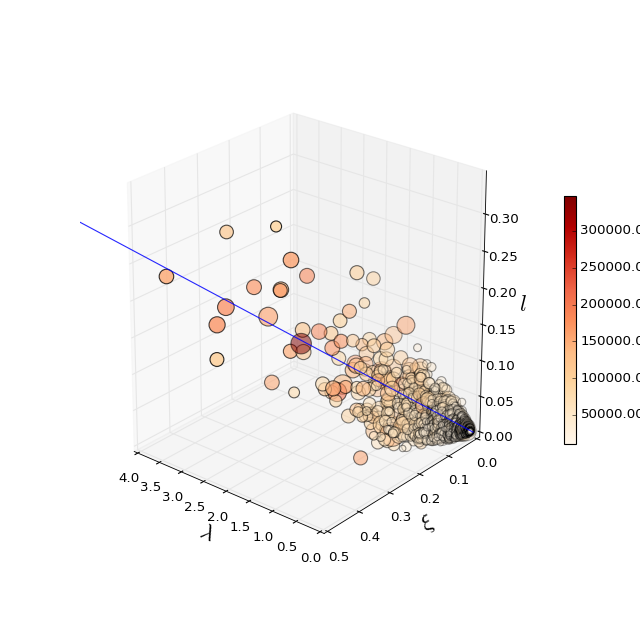
Try to fit the 3d ($\lambda$,$\xi$,$l$) space with PCA.We find the aspect ratio $\lambda$ : $\xi$ : $l$ = $0.93$ : $0.32$ : $0.15$ $\simeq 6 : 2 : 1$
